This tutorial expands on the AutoTrader functionality introduced in Tutorial 5 and adds an live charting and an indicator to decide when to enter into a position. This is basically a very crude replication of an "Expert Advisor" in MetaTrader, or a strategy in MultiCharts. The basic idea is to take any instrument, plot a indicator on it's candle stick chart, start tracking it with every price update, and send trades automatically when certain conditions are met.
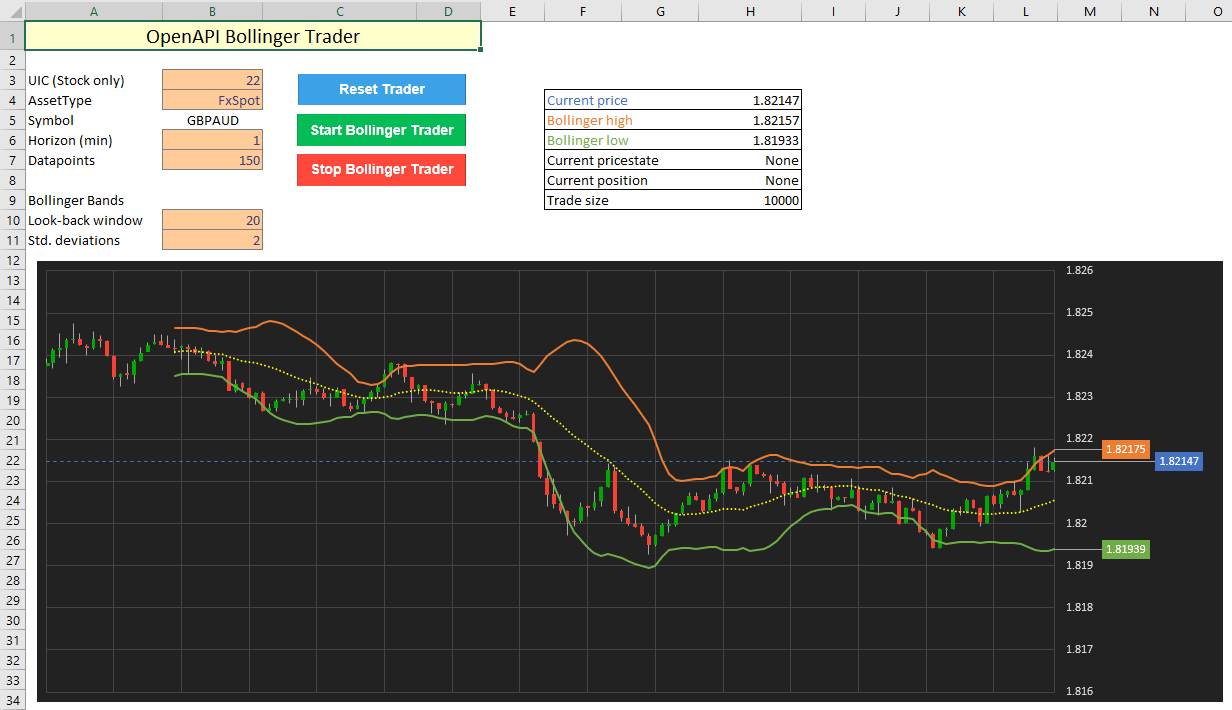
We will reuse the Bollinger Band live chart built in Tutorial 6.1 because it's a great indicator for visual representation and will clearly show us when the current instrument price breaks through one of the bands. The trading rule implemented in this sheet is:
- Start 'from 0' without any open positions.
- When the current price of the instrument breaks into the Bollinger Bands for above, go short. Trade amount is predefined.
- Keep the short position active until the price breaks out on the low side. Close position.
- When the price breaks back into the band from below, go long and keep the position until it hits the top of the band again.
This way, the strategy attempts to profit from small fluctuations in and out of the Bollinger Band. The spreadsheet logs all actions from the Bollinger Band analysis and reports when it goes long/short:
VBA implementation
This auto trader requires quite a bit of VBA, although most of it has been covered before in Tutorial 5 and 6.1.
The new functionality specific to this sheet concerns the logic to compute whether the price has broken in or out of the Bollinger Bands, as shown below.
Private Sub CheckTradeState()
    If [pricest] <> "Breakout Low" And [curp] < [boll] Then
        [pricest] = "Breakout Low"
        If [pos] = "Short" Then
            Call CloseShort
        End If
    End If
    If [pricest] <> "Breakout High" And [curp] > [bolh] Then
        [pricest] = "Breakout High"
        If [pos] = "Long" Then
            Call CloseLong
        End If
    End If
    If [pricest] = "Breakout Low" And [curp] > [boll] Then
        [pricest] = "Re-entry Low"
        If [pos] = "None" Then
            Call EnterLong
        End If
    End If
    If [pricest] = "Breakout High" And [curp] < [bolh] Then
        [pricest] = "Re-entry High"
        If [pos] = "None" Then
            Call EnterShort
        End If
    End If

    If Range("B" & logcounter - 1) <> [pricest] Then
        Call WriteLog
    End If

End Sub
Additionally, a lot of VBA is included to automatically update the chart and align the price markers:
'load data into chart
ActiveSheet.ChartObjects("CandleChart").Activate
ActiveChart.SetSourceData Source:=chartdata

'some complex calls to format the data labels after each refresh
ActiveChart.FullSeriesCollection(5).DataLabels.Delete
ActiveChart.FullSeriesCollection(5).Points(dmax).ApplyDataLabels
ActiveChart.FullSeriesCollection(5).Points(dmax).DataLabel.Select
Selection.Left = ActiveChart.FullSeriesCollection(5).Points(dmax).DataLabel.Left + 70
Selection.Format.TextFrame2.TextRange.Font.Fill.ForeColor.ObjectThemeColor = msoThemeColorBackground1
ActiveChart.FullSeriesCollection(5).Points(dmax).DataLabel.Format.Fill.ForeColor.ObjectThemeColor = msoThemeColorAccent1

ActiveChart.FullSeriesCollection(7).DataLabels.Delete
ActiveChart.FullSeriesCollection(7).Points(dmax).ApplyDataLabels
ActiveChart.FullSeriesCollection(7).Points(dmax).DataLabel.Select
Selection.Left = ActiveChart.FullSeriesCollection(7).Points(dmax).DataLabel.Left + 30
Selection.Format.TextFrame2.TextRange.Font.Fill.ForeColor.ObjectThemeColor = msoThemeColorBackground1
ActiveChart.FullSeriesCollection(7).Points(dmax).DataLabel.Format.Fill.ForeColor.ObjectThemeColor = msoThemeColorAccent2

ActiveChart.FullSeriesCollection(8).DataLabels.Delete
ActiveChart.FullSeriesCollection(8).Points(dmax).ApplyDataLabels
ActiveChart.FullSeriesCollection(8).Points(dmax).DataLabel.Select
Selection.Left = ActiveChart.FullSeriesCollection(8).Points(dmax).DataLabel.Left + 30
Selection.Format.TextFrame2.TextRange.Font.Fill.ForeColor.ObjectThemeColor = msoThemeColorBackground1
ActiveChart.FullSeriesCollection(8).Points(dmax).DataLabel.Format.Fill.ForeColor.ObjectThemeColor = msoThemeColorAccent6