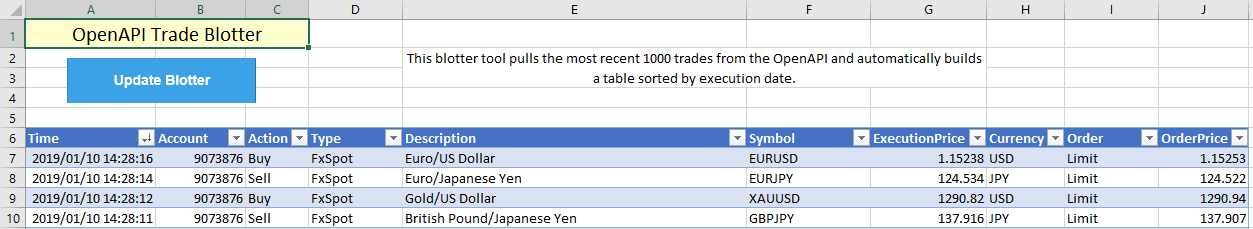
In this tutorial we will explore the /cs/v1/audit/orderactivities/ endpoint with a fairly simple spreadsheet which pulls the latest trades from the user's accounts, loads all data into the specified area on the spreadsheet and automatically creates a table. The table is sorted by ActivityTime, which is the exact time the trade was confirmed on Saxo Bank's servers. Because this endpoint is limited in terms of the number of items it returns, we can only pull the latest 1000 trade confirmations. In addition, the endpoint contains all order activity on the user's accounts, hence filtering by Status is necessary to remove unwanted order confirmations that are not related the actual execution of trades. This tool has a couple of useful features:
- Because the /orderactivities/ endpoint will always return the latest 1000 trades, no additional instructions regarding date and timing are necessary to get the most relevant (recent) data.
- The entire flow is automated using VBA, which makes it quick to update and is especially useful when refreshing the blotter side-by-side with a trading tool (such as SaxoTraderGO).
- Filtering options in the table allow the user to quickly drill down into recent trades:
- Which asset types were traded on the client's accounts?
- Has a certain instrument been traded during the month of December?
- Which order types were used for these trades?
- Given a certain Limit/Stop order, at what price did the trade execute?
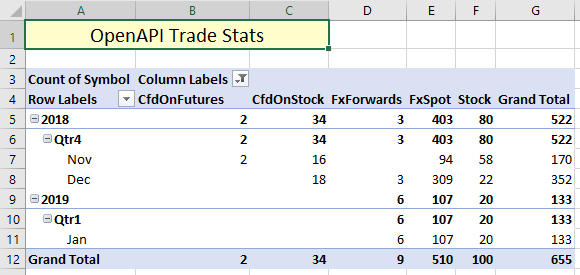
As in Tutorial 3, a dynamic pivot table is added, which is updated every time the source data is loaded. The Blotter table on the first tab serves as source for the pivot on the Stats tab. This allows the client to quickly drill down into his trades and get updated statistics every time the Update Blotter button is clicked.
VBA solution
To automate updates of the trade blotter, the VBA script below uses some familiar functionality to access data from the OpenAPI and loads it on the spreadsheet. In order to refresh the entire table, it is built from scratch every time the user hits the Update Blotter button. This means that all column headers, the construction of the table, and the sorting have to be repeated. The code below takes care of these tasks. Some key points here are:
- As before, the input is verified to prevent unwanted errors. Because this is a relatively basic flow, the only check required concerns the result of the API call using the TypeName() function.
- The table is created dynamically and always takes the full range of the loaded data.
- On each refresh, the table is labeled 'Blotter' and sorted automatically descending by Time.
Sub GetHistoricTrades()

    Range("A6:J1008").ClearContents 'clear all data from sheet

    Dim ckey As String
    Dim query As String
    Dim fields As String
    Dim DataLog As Variant

    'set clientkey variable
    ckey = Application.Run("OpenApiGetClientKey")

    'set query and fields strings
    query = "/openapi/cs/v1/audit/orderactivities/?FieldGroups=" & _
    "displayandformat&Status=FinalFill&ClientKey=" & ckey
    fields = "ActivityTime,AccountId,BuySell,AssetType," & _
    "DisplayAndFormat.Description,DisplayAndFormat.Symbol,ExecutionPrice," & _
    "DisplayAndFormat.Currency,OrderType,Price"

    'pull entire activity log from OpenAPI
    DataLog = Application.Run("OpenApiGet", query, fields)

    If TypeName(DataLog) <> "Variant()" Then GoTo unexperror

    'set column names
    Range("A6").Value = "Time"
    Range("B6").Value = "Account"
    Range("C6").Value = "Action"
    Range("D6").Value = "Type"
    Range("E6").Value = "Description"
    Range("F6").Value = "Symbol"
    Range("G6").Value = "ExecutionPrice"
    Range("H6").Value = "Currency"
    Range("I6").Value = "Order"
    Range("J6").Value = "OrderPrice"

    'load all data onto sheet
    Range("A7:J" & 6 + UBound(DataLog)).Value = DataLog

    'create table
    ActiveSheet.ListObjects.Add(xlSrcRange, Range("$A$6:$J$" & 6 + UBound(DataLog)), , xlYes).Name = _
        "Blotter"
    Range("Blotter[#All]").Select
    ActiveWorkbook.Worksheets("Blotter").ListObjects("Blotter").Sort.SortFields. _
        Clear

    'sort by execution date
    ActiveWorkbook.Worksheets("Blotter").ListObjects("Blotter").Sort.SortFields. _
        Add2 Key:=Range("Blotter[[#All],[Time]]"), SortOn:=xlSortOnValues, Order:= _
        xlDescending, DataOption:=xlSortNormal

    With ActiveWorkbook.Worksheets("Blotter").ListObjects("Blotter").Sort
        .Header = xlYes
        .MatchCase = False
        .Orientation = xlTopToBottom
        .SortMethod = xlPinYin
        .Apply
    End With

    'update the pivot table on the stats sheet by refreshing its cash
    Sheets("Stats").PivotTables("Stats").PivotCache.Refresh

    Range("A7").Select
    Exit Sub

unexperror:     'capture unexpected error
    MsgBox "An unexpected error occured." & vbNewLine & _
    "Please check if you are logged in."
    Exit Sub

End Sub
Known bug:
Currently, this tool returns the first thousand trades from the activity log because this is the default behavior of the endpoint. If there are more than 1000 trades executed on the client's accounts, the more recent trades will not show.