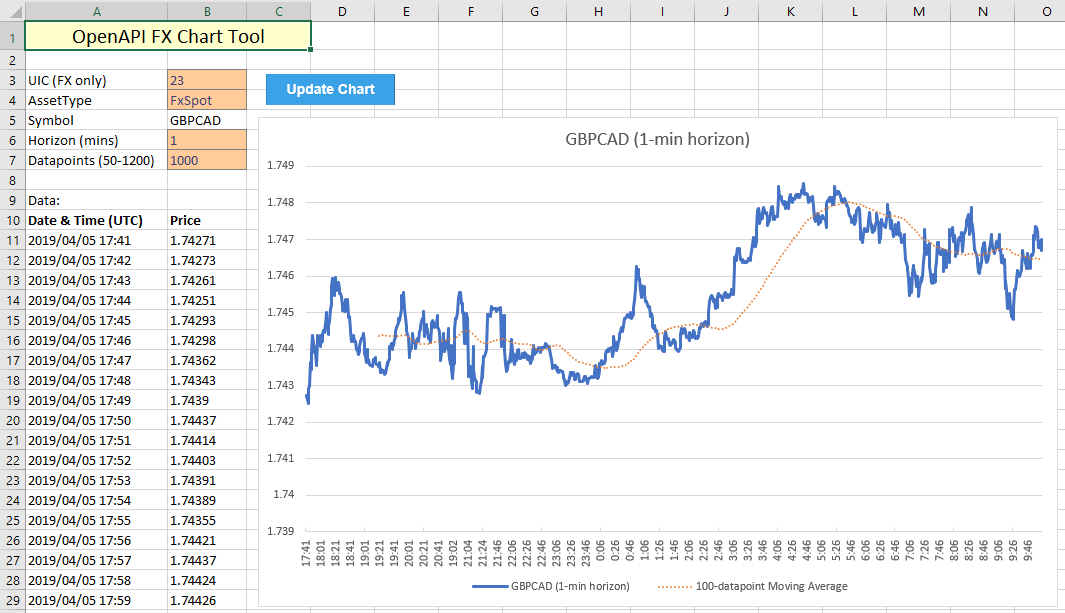
Using the search tool developed in Tutorial 1, we can now start looking into slightly more complex interactions with the OpenAPI. In this tutorial, we will investigate how to pull historic FX pricing data from the OpenAPI and build a simple price graph. To facilitate this process and automate the data, checks, and updates to the graph, a bit of VBA is included with the above spreadsheet.
Real-time pricing data is available for FX instruments across Saxo Bank's products, including OpenAPI for Excel. This tutorial restricts the AssetType to FX, as market data for other instruments has to be enabled separately.
Two endpoints will be explored in this tutorial:
- /ref/v1/instruments/details/, in order to obtain the symbol for any valid UIC/AssetType combination.
- /chart/v1/charts/, to pull historic pricing data.
Basic framework
This charting tool will pull the most recently available data from the OpenAPI and automatically update the chart accordingly. The /chart/v1/charts/ endpoint is limited to 1200 datapoints per request (if available) and requires the following parameters:
- Uic
- AssetType
- Horizon
To add additional functionality, the following parameters will be passed in addition to the above:
- Count, to limit the graph to a certain number of datapoints.
- Mode, to instruct the API to return the most recent values.
- Time, which indicates the starting point of the time series and will be automatically updated using the Now function VBA.
A simple API call is added to pull the symbol of the UIC/AssetType combination entered by the user, which sits in cell A5:
=OpenApiGet("/openapi/ref/v1/instruments/details/?Uics="&Chart!B3&"&
AssetTypes="&Chart!B4&"&FieldGroups=","Symbol")
Instruments other than FX can be tested in this framework as well, although results may vary depending on whether market data is enabled on the user's account. Error handling in the VBA code below takes care of edge cases where the returned message from the API is not in the expected format. Make sure to add AssetType options through Data Validation when testing this on a broader range of instruments. For more information on Market Data in our LIVE environment, see: Enabling Market Data.
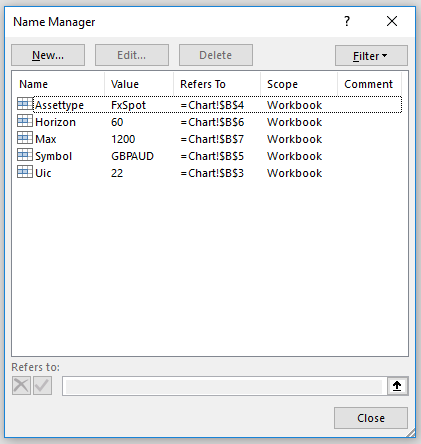
Named cells
The below cells are named in this spreadsheet, which allows for easy referencing in VBA. See Formulas → Name Manager for more information.
Adding some VBA
Now that all the inputs are in place (using names cells) the below VBA is assigned to the Update Chart button to automatically pull the most recent data. See the comments added to the code below to get a better understanding of the intended workflow. The key points in this script are:
- The query URL string and parameters are automatically constructed based on the provided inputs, combining the values of the provided fields with the relevant request parameters such as AssetType, Uic and Horizon.
- The value for &Time= is automatically set to "Now", which returns the current date and time in VBA. To prevent localization settings from sending incorrect dates to the API, this string is converted to yyyy/mm/dd hh:mm:ss.
- The &Mode= parameter is set to "UpTo", instructing the OpenAPI to return data up until the date provided in &Time=.
- Errors are handled by checking data types, returned values, and the value from the above formula that pulls the symbol of the UIC/AssetType combination. These errors show message boxes, the VBA code for which is included at the bottom of the below code block.
- The chart is pointed at the newly obtained data, taking into account that the size of the data can change depending on user settings and availability.
- The chart title is automatically updated using the value returned by the API call above (cell A5, named "Symbol") and the parameters passed the /chart/v1/charts/ endpoint (horizon in this case).
Option Explicit

'create wrapper function that ingests required input data from the spreadsheet
Sub UpdateChart()

    'the &Time parameter will be set to "Now", which returns today's date and time in VBA
    Call GetChartData([Uic], [AssetType], [Horizon], Now, [Max])

End Sub

'ingest parameters into function that performs the API call
Sub GetChartData(Uic As Integer, AssetType As String, _
    Horizon As Integer, t As String, Count As Integer)

    'capture incorrect input errors
    If [Symbol] = "Not Found" Then GoTo inputerror

    Dim query As String 'set variables
    Dim data As Variant
    Dim DataCells As Range
    Dim dmax As Integer
    Dim ChartTitle As String

    'create the query string using the input values
    'format "Now" to the correct string for the API to interpret
    query = "/openapi/chart/v1/charts?AssetType=" & AssetType & "&Uic=" _
    & Uic & "&Horizon=" & Horizon & "&Time=" & Format(t, "yyyy/mm/dd hh:mm:ss") _
    & "&Mode=UpTo" & "&Count=" & Count

    'perform API call and assign result to "data" variable
    data = Application.Run("OpenApiGet", query, "Time,CloseBid")

    'capture if error is returned by API (which is string type)
    If TypeName(data) <> "Variant()" Then GoTo unexperror

    'clear data cells
    Range("A11:B1210").ClearContents 'clear range of cells that contain the data

    'define range on sheet where data is returned
    dmax = UBound(data)
    Set DataCells = Range("A11:B" & 10 + dmax)
    DataCells = data 'load data onto spreadsheet

    'check for empty Variant() error
    If Len(Range("B11").Value) = 1 Then GoTo dataerror

    'activate chart, assign refreshed data, change chart title
    ActiveSheet.ChartObjects("Price Chart").Activate
    ActiveChart.SetSourceData Source:=DataCells
    ChartTitle = [Symbol] & " (" & [Horizon] & "-min horizon)"
    ActiveChart.SeriesCollection(1).Name = ChartTitle
    Exit Sub

inputerror:     'capture input error
    MsgBox "Error: Could not complete request." & vbNewLine & _
    "It looks like that combination of UIC / AssetType does not exist."
    Exit Sub

unexperror:     'cature unexpected error
    MsgBox "An unexpected error occured." & vbNewLine & _
    "This could be caused by data access rights." & vbNewLine & _
    "Returned error: " & data
    Exit Sub

dataerror:      'capture errors where no data is returned
    MsgBox "Error: No data returned for this instrument." & vbNewLine & _
    "It looks like you do not have access to market data for this instrument in Excel."
    Exit Sub

End Sub